Equity

Unlocking more of Northeast Ohio’s potential

Closing gaps in income, education, employment, and internet access strengthens the region’s talent base

Income gains for Black and Hispanic workers are approaching 30%, educational attainment is rising, and unemployment is at historic lows. But persistent earnings gaps and educational attainment disparities mean more targeted work is needed to unlock the region’s full potential.

Ohio is the #1 state for business, set over the Cleveland skyline

New on the site

Ohio is the #1 state for business

CNBC ranked Ohio first among all 50 states in 2025. See how the state has placed each year, charted alongside the rest of the competitiveness indicators.

What this tells you

The data, shaped around your work.

Job Growth

Employment up across demographics

Unemployment rates are down, most prominently among workers identifying as some other race, Black, and Hispanic.

Degree attainment

BA attainment increasing

Bachelor’s degree attainment is climbing for nearly all demographic groups, led by a 29% increase since 2018 for those of Hispanic or Latino origin.

Traded-sector employment

More workers in traded sector

The percent of workers employed in traded-sector jobs with family-sustaining wages is rising among all demographic groups.

Ohio's economic future will be built by the people who are willing to learn, grow, and adapt. From advanced manufacturing to healthcare, it's important that we have pathways available to connect more people with those opportunities.

Ohio Lieutenant Governor Jim Tressel

Metric 01

Median household income

Tracks income across racial and ethnic groups to show where gaps are closing and where opportunities remain.

Methodology & definitions

Median Household Income Measures the median household income broken down by Race and Ethnicity. This metric enables us to identify income gap progress between different Racial or Ethnic groups over time.

Source — U.S. Census Bureau, ACS 5-year estimates

42% Income growth Income for Hispanic workers increased 42% and income for Black workers grew nearly 29% since 2018
$35k income gap between demographics Asian median household income was $85k, nearly $45k higher than American Indian & Alaska-Native median household income in 2024 (highest vs. lowest).
8 Groups tracked Race and ethnicity breakdowns across the full ACS demographic set.

A decade-long trend is starting to shift

Over the past several years, Black and Hispanic workers in Northeast Ohio have seen noticeable gains in income, with increases approaching 29% for Black individuals and 42% for Hispanic individuals. This is a significant shift after a decade of comparatively flat growth. The gains coincide with a tighter labor market and expanded training and credentialing opportunities across Northeast Ohio.

Still, an earnings gap persists. Asian households earn $85,000 at the top of the chart, while American Indian & Alaska-Native households and Black households earn $40,000 and $46,000, respectively, at the bottom of the chart. Closing this gap will require stronger pathways to good-paying, in-demand careers and continued alignment between talent development and employer needs.

Income is rising, but gaps remain

Eight race and ethnicity groups, 2018 to 2024. The story has two threads: income has increased for nearly all groups since 2018, but disparities between the highest and lowest earners persist.

Northeast Ohio · median household income · 2018–2024

Metric 02

Unemployment rate

Tracks unemployment by race, ethnicity, and gender to show how employment varies across groups over time and where progress is needed.

Methodology & definitions

Unemployment Rate Measures the unemployment rate broken down by Race, Ethnicity and Gender. This metric enables us to identify and compare unemployment levels between demographic groups over time.

Source — U.S. Census Bureau, ACS 5-year estimates

9.4% Black unemployment, 2024 Down from 12.7% in 2018, but still well above every other demographic.
3.8% White unemployment, 2024 Held steady at a relatively low level from 2018–2024, dipping under 4% from 2023-2024.
3.8% women’s unemployment, 2024 Down from 4.3% in 2018.

Historically low unemployment. An opportunity for greater participation.

Unemployment rates are at historic lows for most Northeast Ohioans. By 2024, rates for White, Asian, Hispanic and those identifying as some other race fell below 5%, reflecting a strong and broad-based recovery across the region.

But not everyone is benefiting equally. Unemployment among Black workers remains above 9%, an improvement from 2018, but still significantly higher than other groups. Connecting more residents to good-paying careers and increasing labor force participation can expand opportunity, strengthen the region’s talent pool, and fuel continued economic growth.

One labor market. Different outcomes.

Race and gender breakdowns, 2018 to 2024. Most lines hover near 4%. Unemployment among those who identify as Black or two or more races remain meaningfully higher.

Northeast Ohio · unemployment rate · 2018–2024

Metric 03

Educational attainment

Share of a demographic group age 25 and older that has received a bachelor's degree or higher.

Methodology & definitions

Bachelor's+ Educational Attainment Measures the percentage of a demographic group that has received a Bachelor's degree or higher, and is at least 25 years old. Tracking this metric over time is critical for identifying demographic groups that face barriers to completing education, and to measure progress.

Source — U.S. Census Bureau, ACS 5-year estimates

18% Women's bachelor's-plus gain Women saw an 18% increase in bachelor's-plus completions since 2018.
8 of 10 Cohorts moving up Attainment rose for every group except Asian. Despite not gaining, the Asian cohort remains at the top of the pack.
57% Asian bachelor's-plus attainment More than 20% higher than any other demographic group.

More Northeast Ohioans are earning degrees. Women lead the growth.

From 2018 to 2024, nearly all race groups saw an increase in bachelor's-plus educational attainment. Women saw an 18% increase in bachelor's-plus completions, double that of men.

Rising attainment strengthens Northeast Ohio’s talent base and helps more residents prepare for in-demand careers. Continued collaboration among higher education, workforce organizations, and employers can build on this progress, expand opportunity, and ensure talent development keeps pace with business needs.

Educational attainment is rising

Bachelor's-plus share by race, ethnicity, and gender, 2018 to 2024. A total of 8 of the 9 trendlines show steady growth.

Northeast Ohio · adults age 25+ · 2018–2024

Metric 04

Internet access

Share of a race or ethnic group that has an internet subscription in the household.

Methodology & definitions

Population with an Internet Subscription Measures the percentage of a race or ethnic group that has an internet subscription in the household. This metric enables us to identify demographic groups that face barriers to internet access.

Source — U.S. Census Bureau, ACS 5-year estimates

22% INCREASE IN BROADBAND ACCESS AMONG BLACK HOUSEHOLDS Black households experienced the largest increase in broadband access of any demographic group from 2018 to 2024.
95% Asian households with broadband The highest rate in the region, up from 89% in 2018.
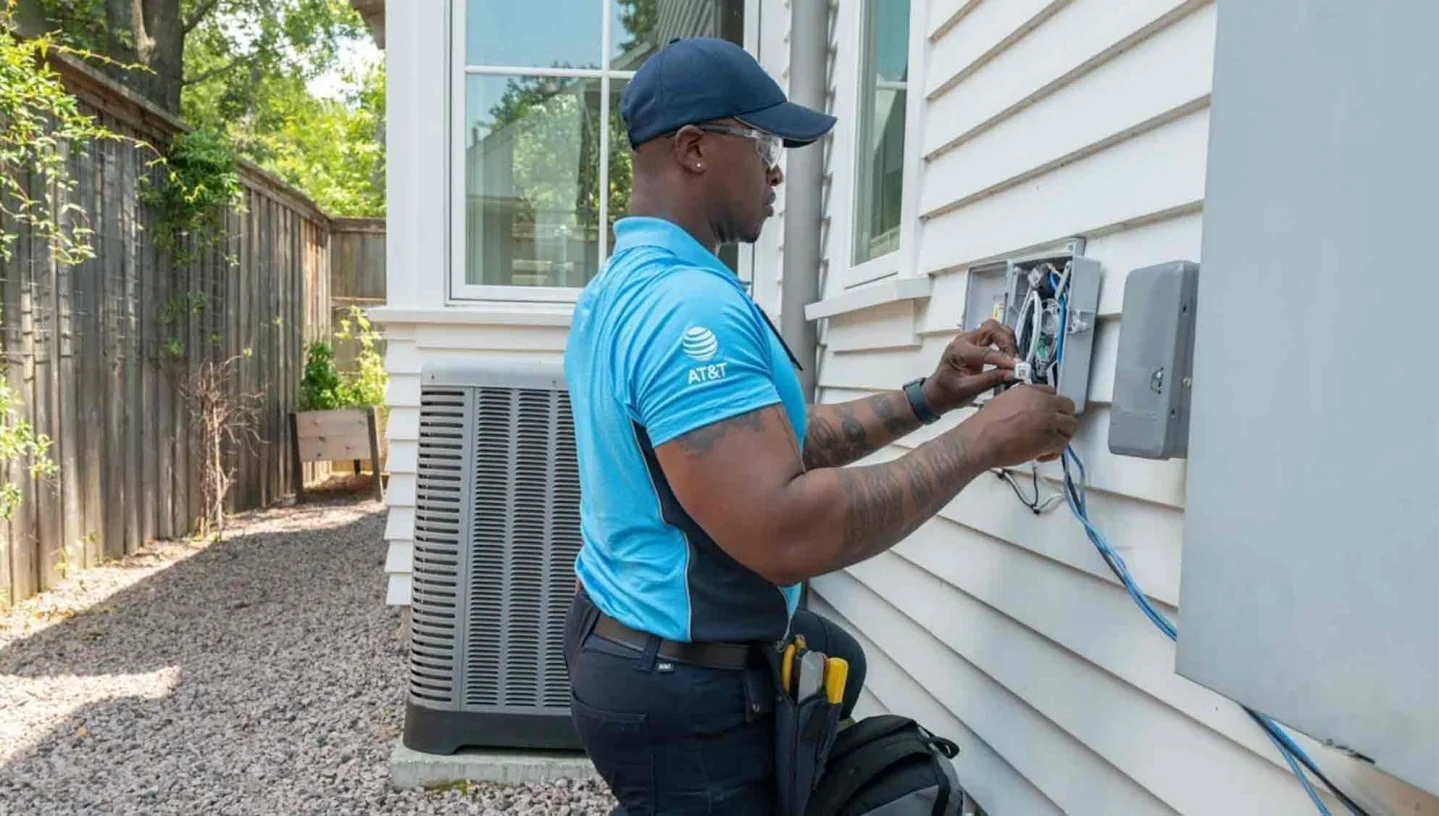
14K East Cleveland residents with internet access Wired end-to-end by the JobsOhio + AT&T fiber partnership, launched in 2024.

Where the fiber lands, adoption follows.

Internet access is a crucial component to fully participate in a modern economy, connecting people to jobs, education, markets, and services. In Northeast Ohio, all race groups saw an increase in broadband internet subscriptions from 2018-2024. Black or African American households saw the largest increase, growing by nearly 22%.

The gains correspond with local investment in infrastructure connecting homes and businesses to high-speed broadband. JobsOhio and AT&T are wiring East Cleveland end-to-end with affordable plans for households with lower incomes. This marks a huge opportunity for a city that, a few years ago, had limited fiber options at any price.

Broadband access climbed across nearly every group.

Household broadband subscriptions by race and ethnicity, 2018 to 2024. Black households saw the fastest growth; Asian households maintain the highest overall rate of broadband subscriptions.

Northeast Ohio · share of households with broadband · 2018–2024

Regional initiative

JobsOhio and AT&T Fiber Partnership

In 2024, JobsOhio and AT&T partnered to bring a state-of-the-art fiber network to the entire city of East Cleveland and its 14,000 residents, and to offer affordable plans for low-income households.

Metric 05

Top Traded Sector Jobs

The share of employed residents, by race and ethnicity, working in high-demand traded-sector jobs that pay family-sustaining wages. This metric shows who is who is gaining access to the region’s good-paying, high-demand careers.

Methodology & definitions

Top Traded Sector Jobs Jobs commonly employed in traded-sector industries with median hourly earnings over $26.83 in Northeast Ohio (the family-sustaining wage for two adults, both working, with two children). Measured as the percent of each race and ethnic group's employed population that works in Top Traded Sector Jobs.

Source — Lightcast Occupation Demographics

31% In traded-sector jobs Nearly 1/3 of the region’s workforce is employed in traded-sector jobs with family- sustaining wages ($26.83 or more).
14% Rise The percent of Black and Hispanic cohorts who hold traded sector jobs went up by approximately 2% from 2018-2024.
+10% Representation gap The gap between underrepresented groups and overall workforce in traded sectors.

Who is moving into the jobs the region needs most

The in-demand jobs metric, viewed through the equity lens, asks whether the region's fastest-growing occupations are being filled equitably across demographic groups, or whether patterns of underrepresentation will compound as those occupations scale.

in-demand jobs by representation

Traded-sector jobs that provide a family-sustaining wage have increased across all demographics since 2018.

Northeast Ohio · top traded sector jobs · 2018–2024

Request the data

Need the full dataset for Equity?

Team NEO shares the underlying indicators with partners, planners, and decision makers who want to dig deeper.